One of the largest hangups that clients have is the lack of movement on the scale. Weight loss, however, isn’t linear. Let’s take a look at a sample of a few dozen real-life data points to see what successful weight loss really looks like.
I’ve seen a lack of real-world client weight loss examples, so I thought it would be helpful to share some data–especially for those who are experiencing weight loss stalls.
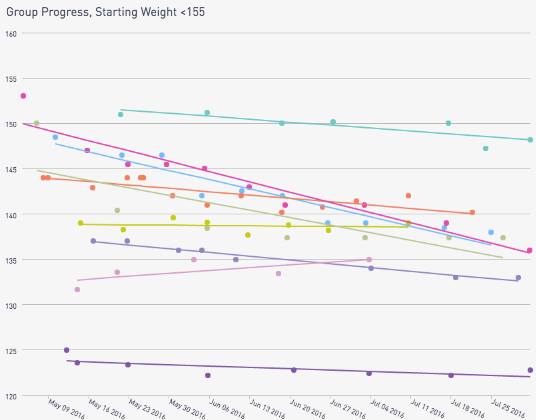
Below is a sample of a few dozen clients who have lost more than 5% of their bodyweight. Some have lost a tremendous amount in the last year–about 50 pounds or more. Here is an anonymized graph of their weights.
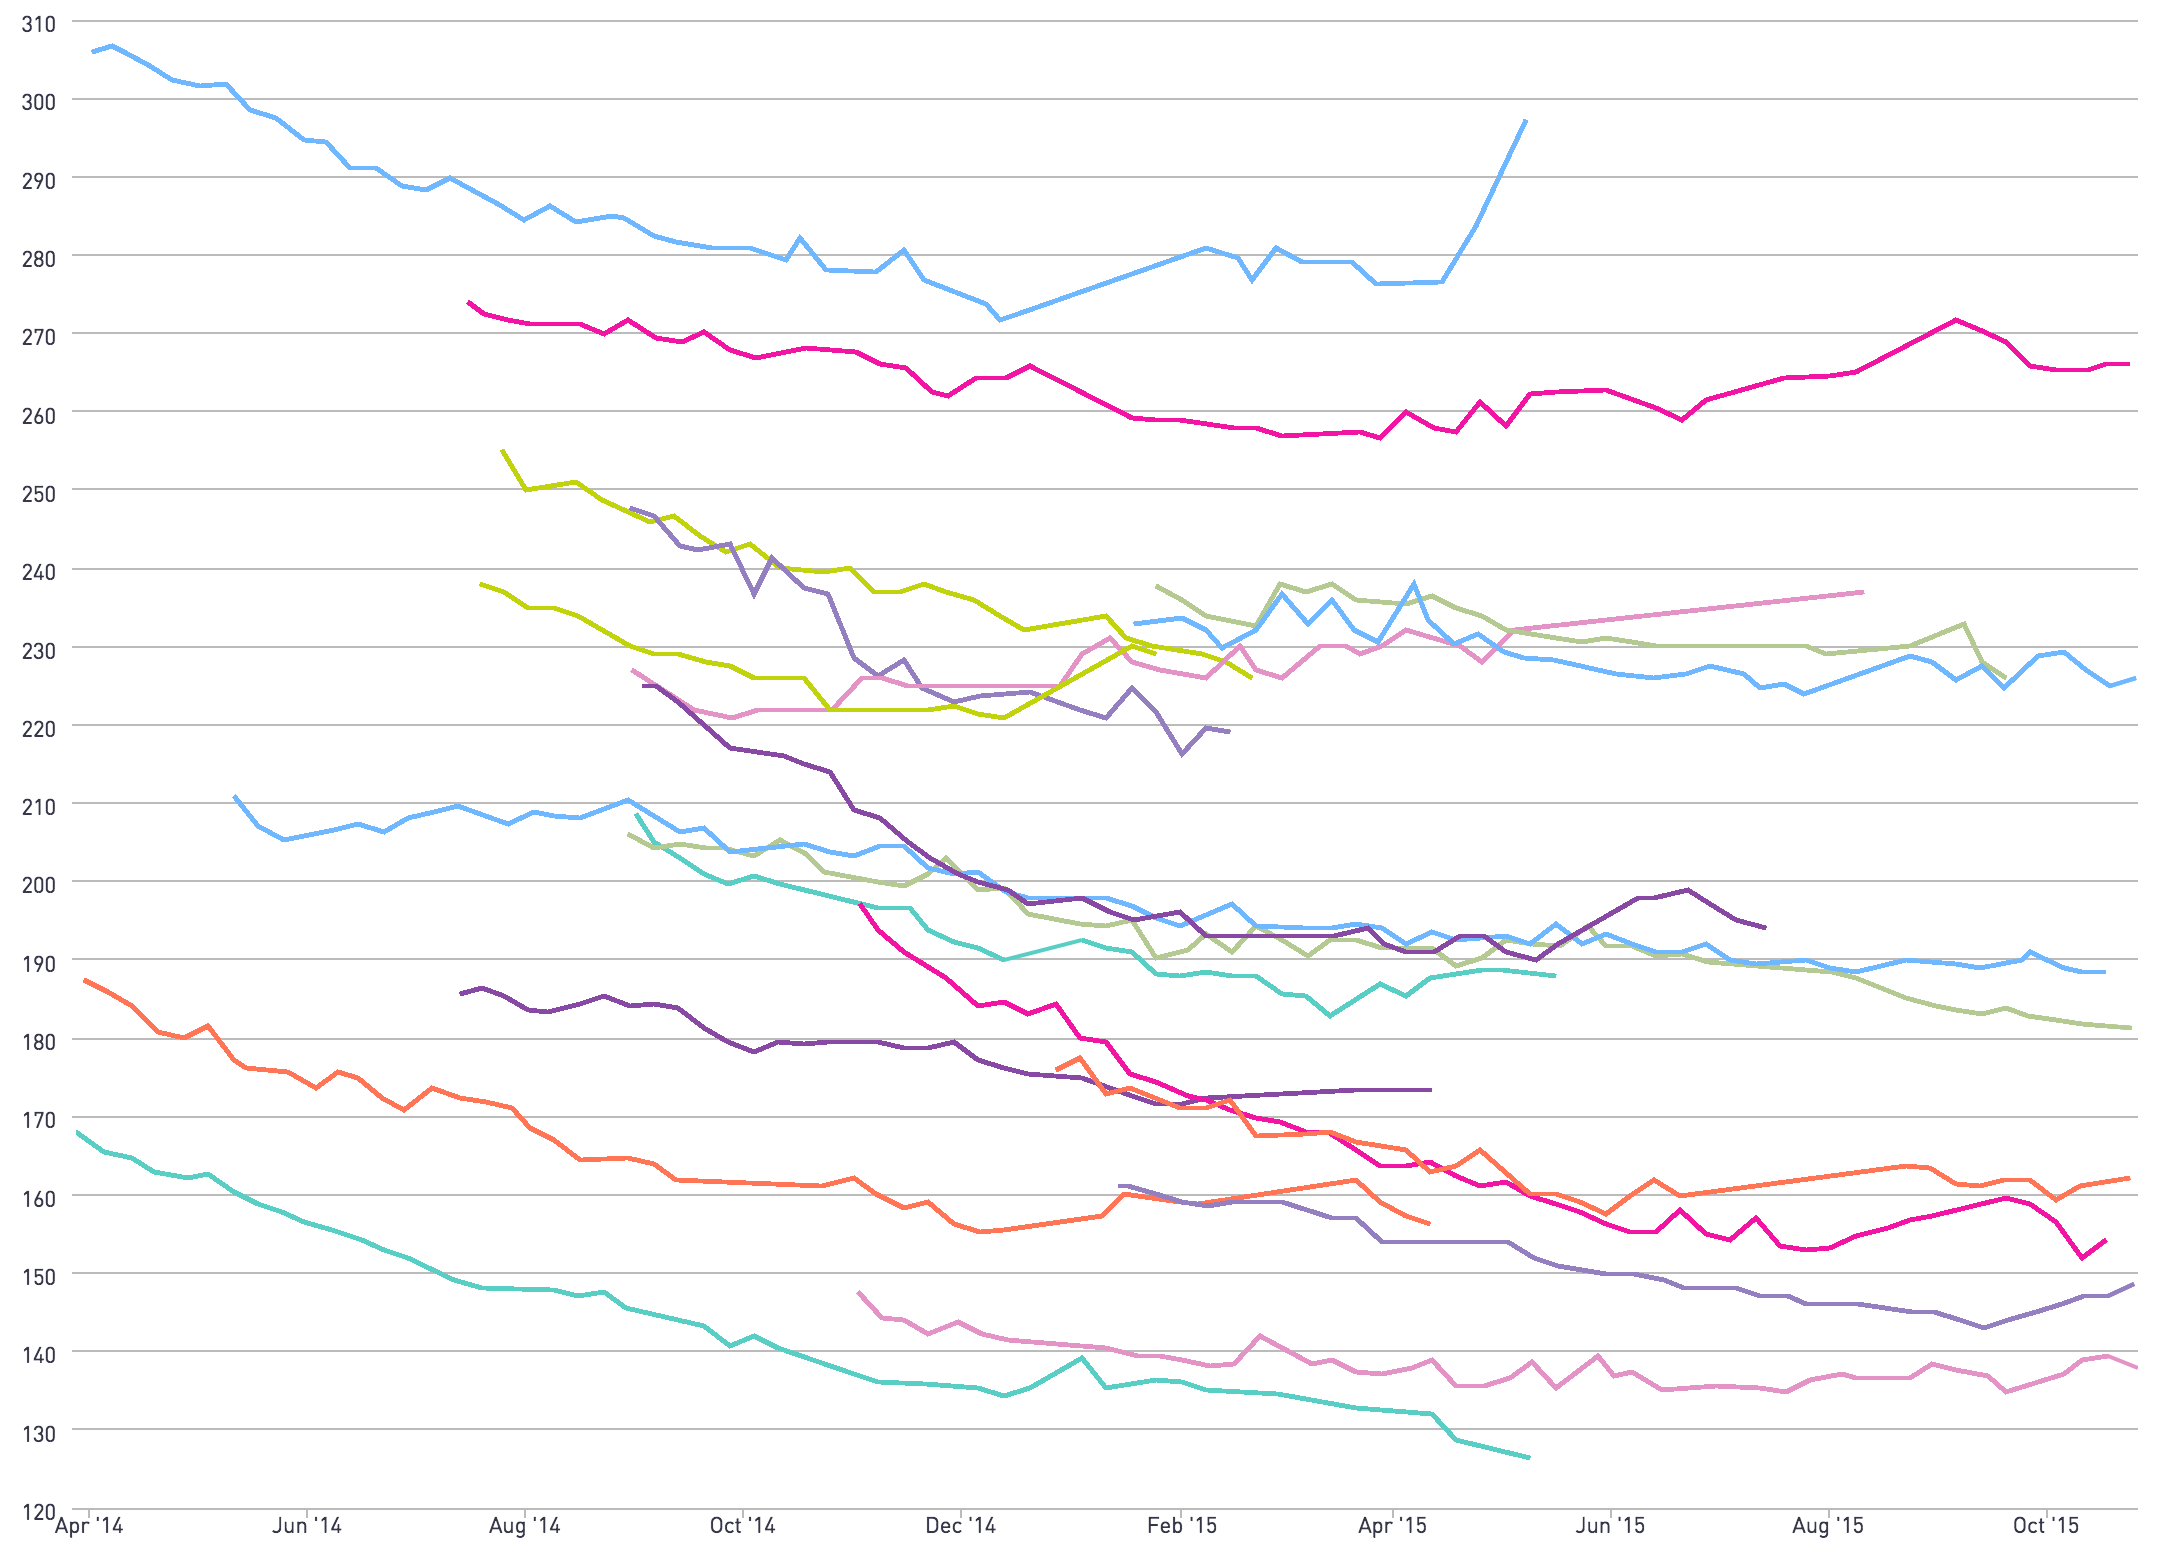
If you look at any of the above lines, you’ll see the following.
1. Successful weight loss isn’t linear, nor is it a smooth curve that slows down over time. For most people it’s almost like a bumpy curve that trends downwards, but is full of localized, short-term peaks and valleys.
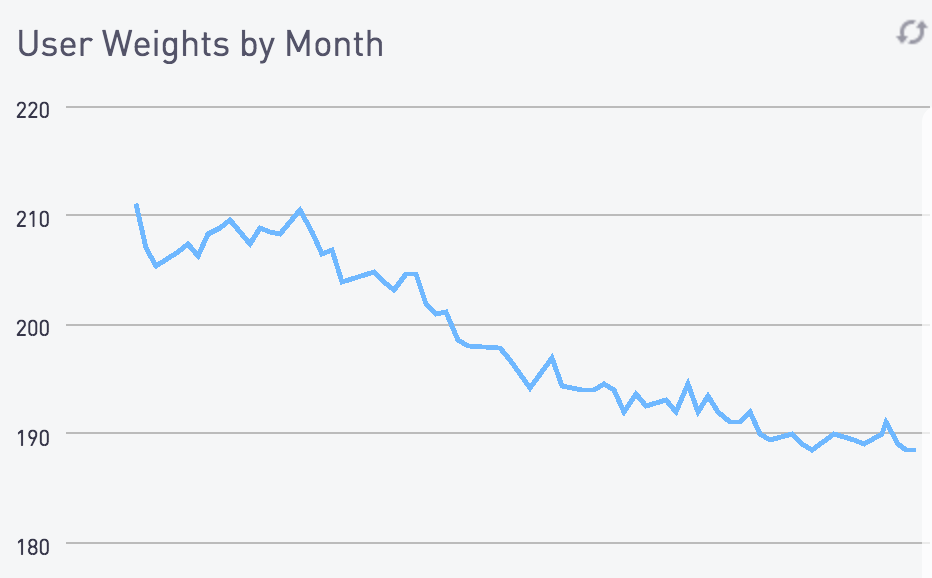
For example, this client’s progress looks relatively smooth at a distance.
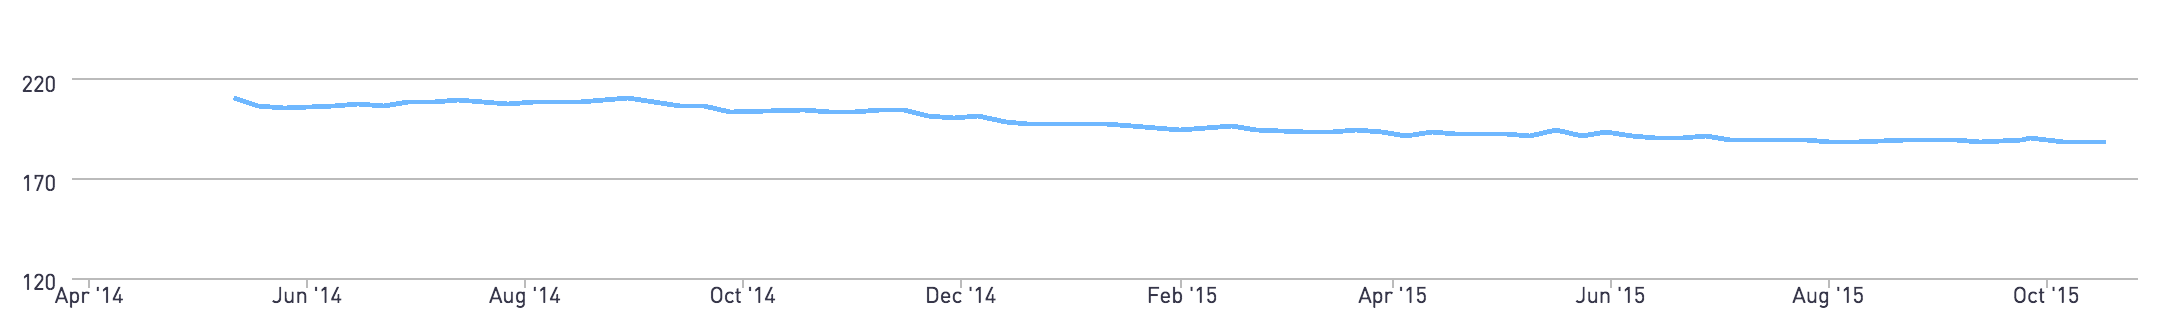
But if we zoom in, we see that it’s anything but smooth.
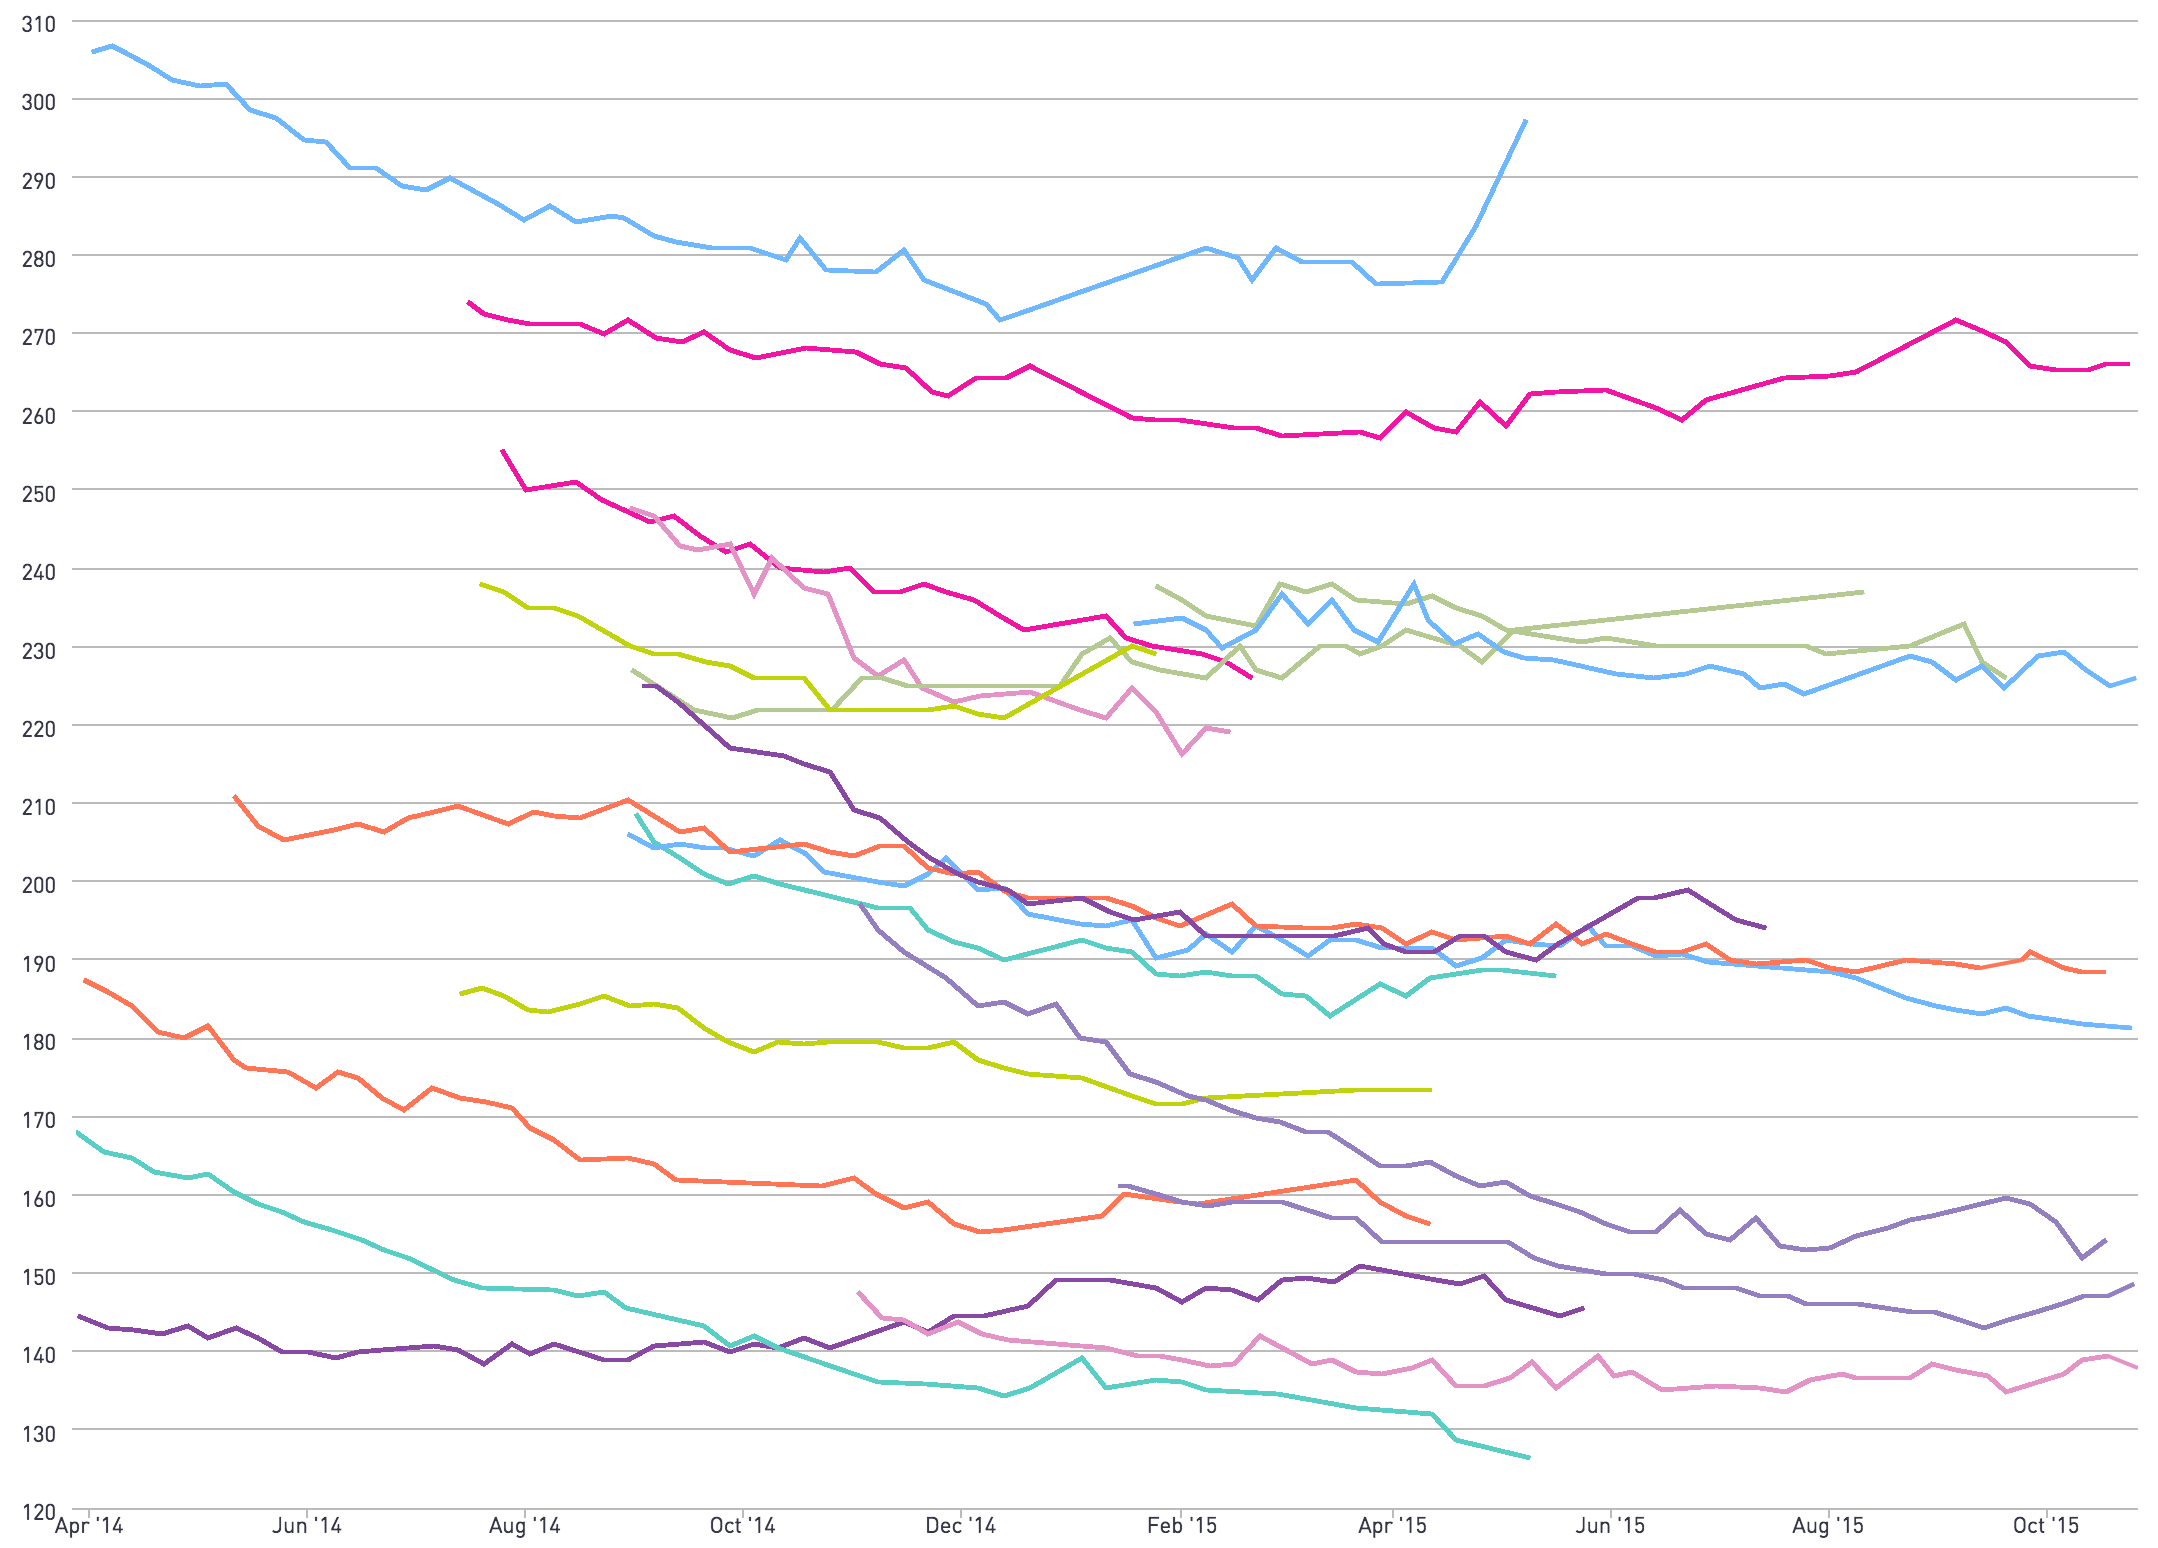
 2. While their weights clearly show a downward trend, if you take a 1-2 month cross section of any of these users, you will see progress stall and reach a local minima of their weight. Take this client that lost 40 pounds for example.
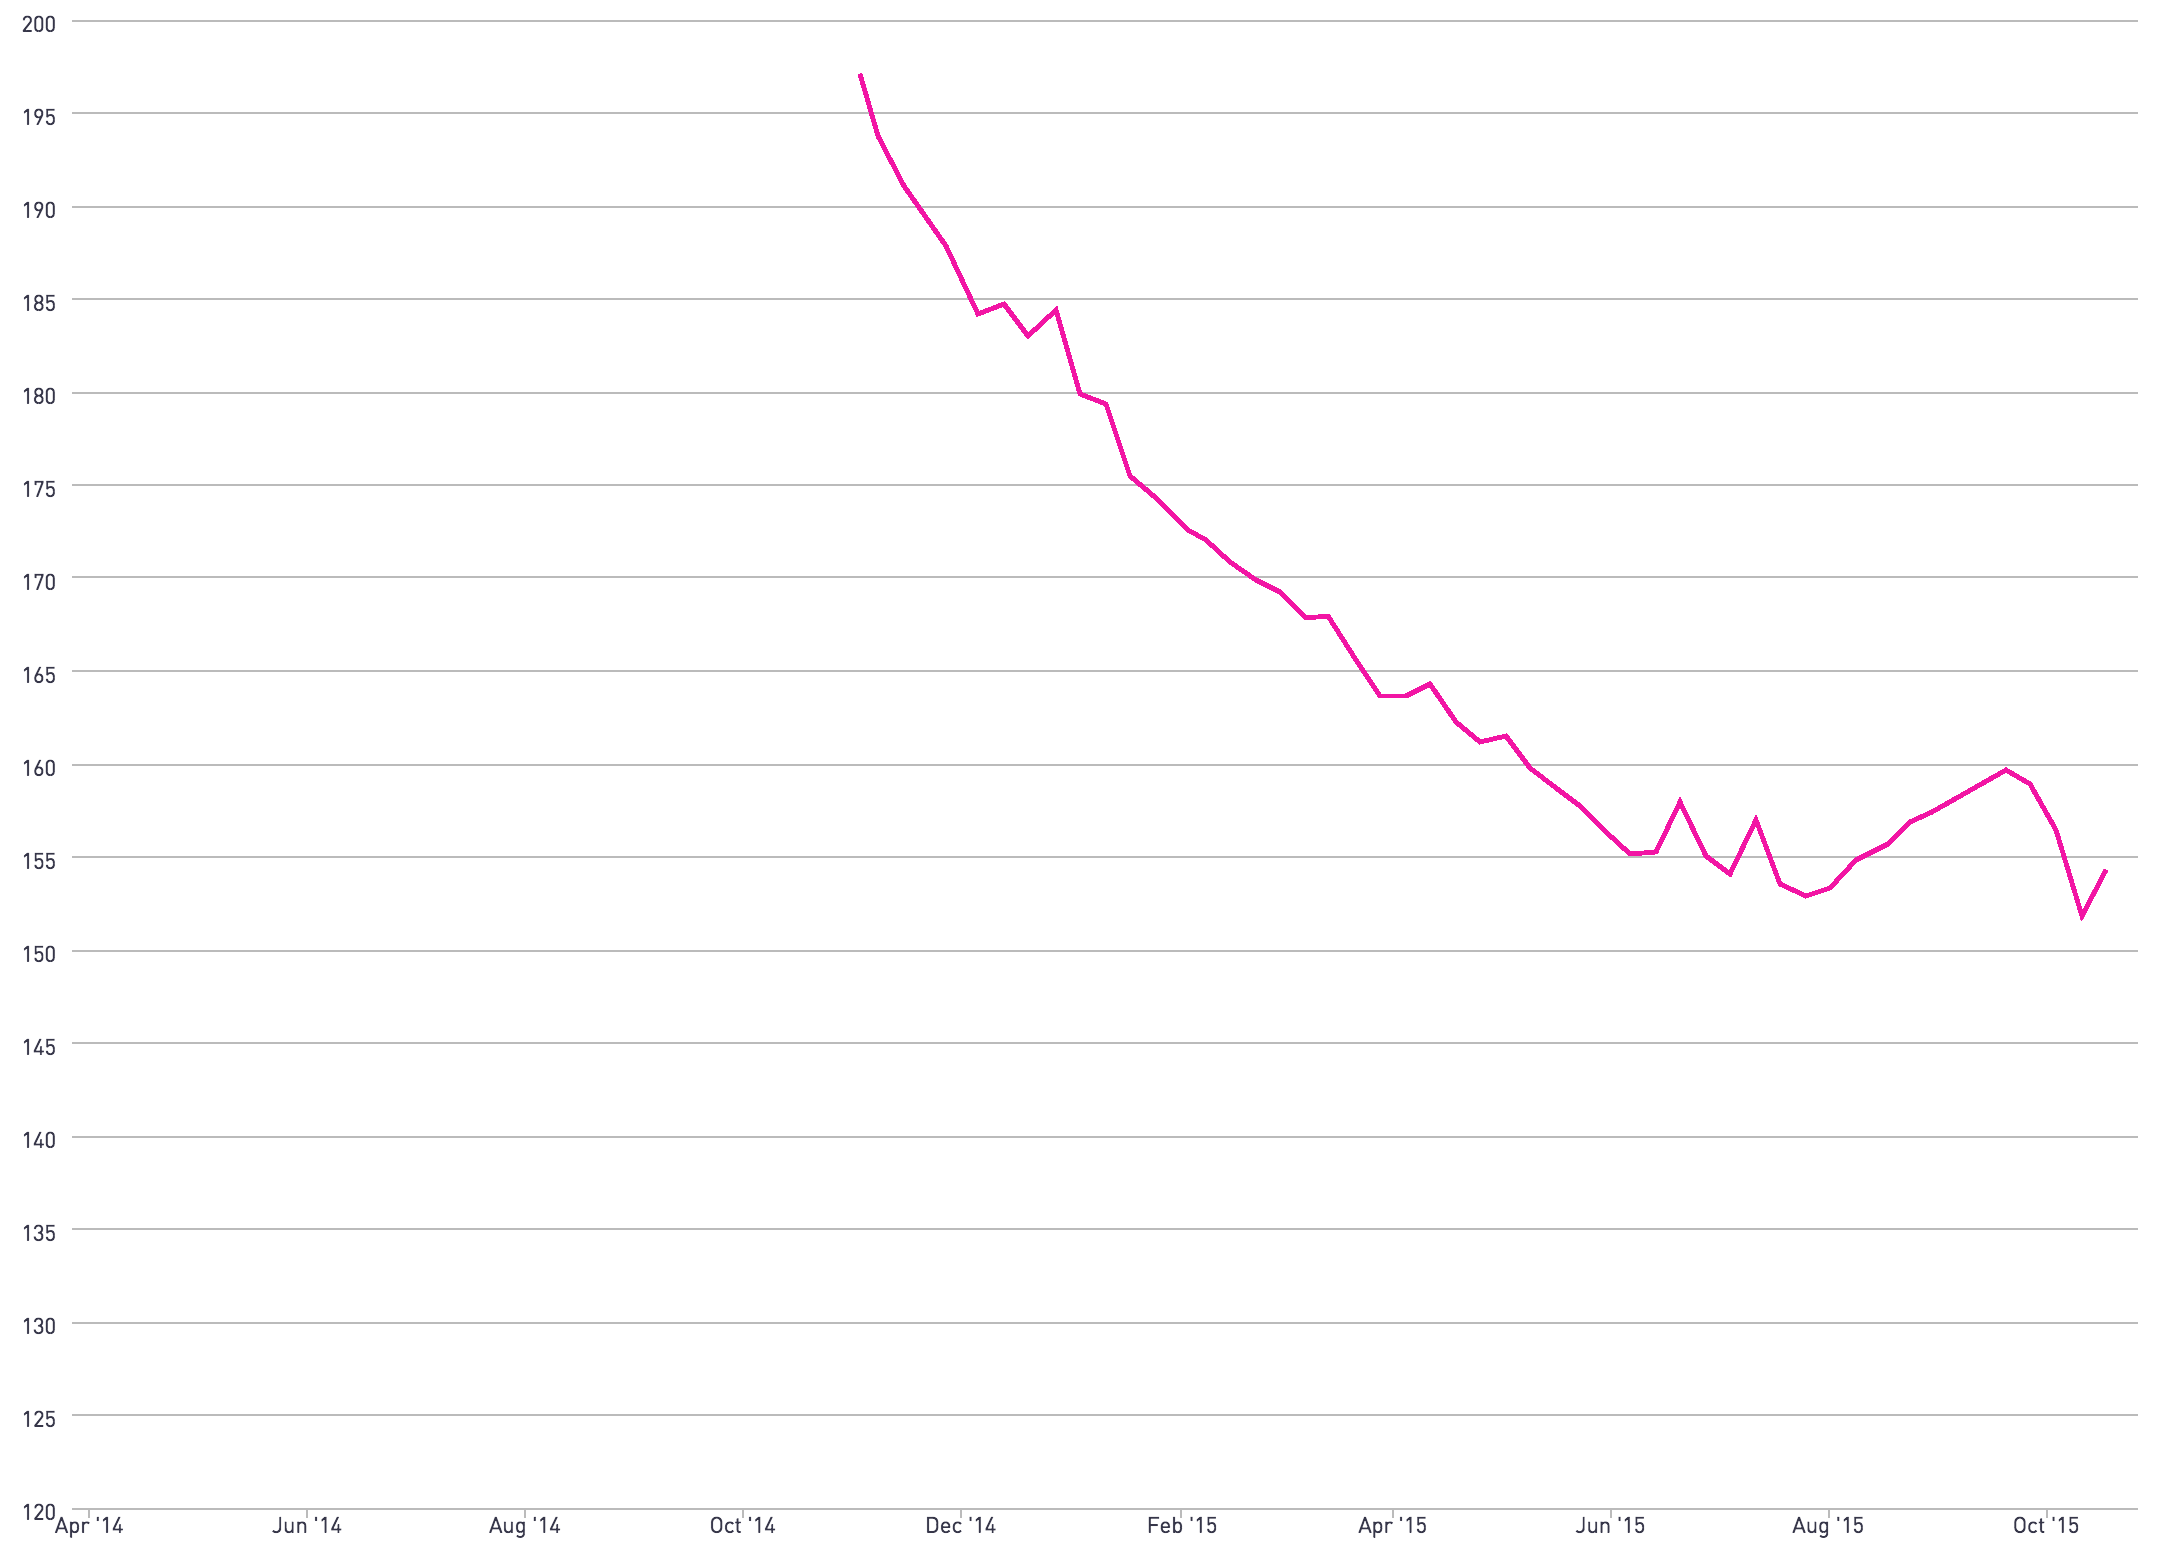
If you take a three-month cross section of their weight loss progress, it looks like this. 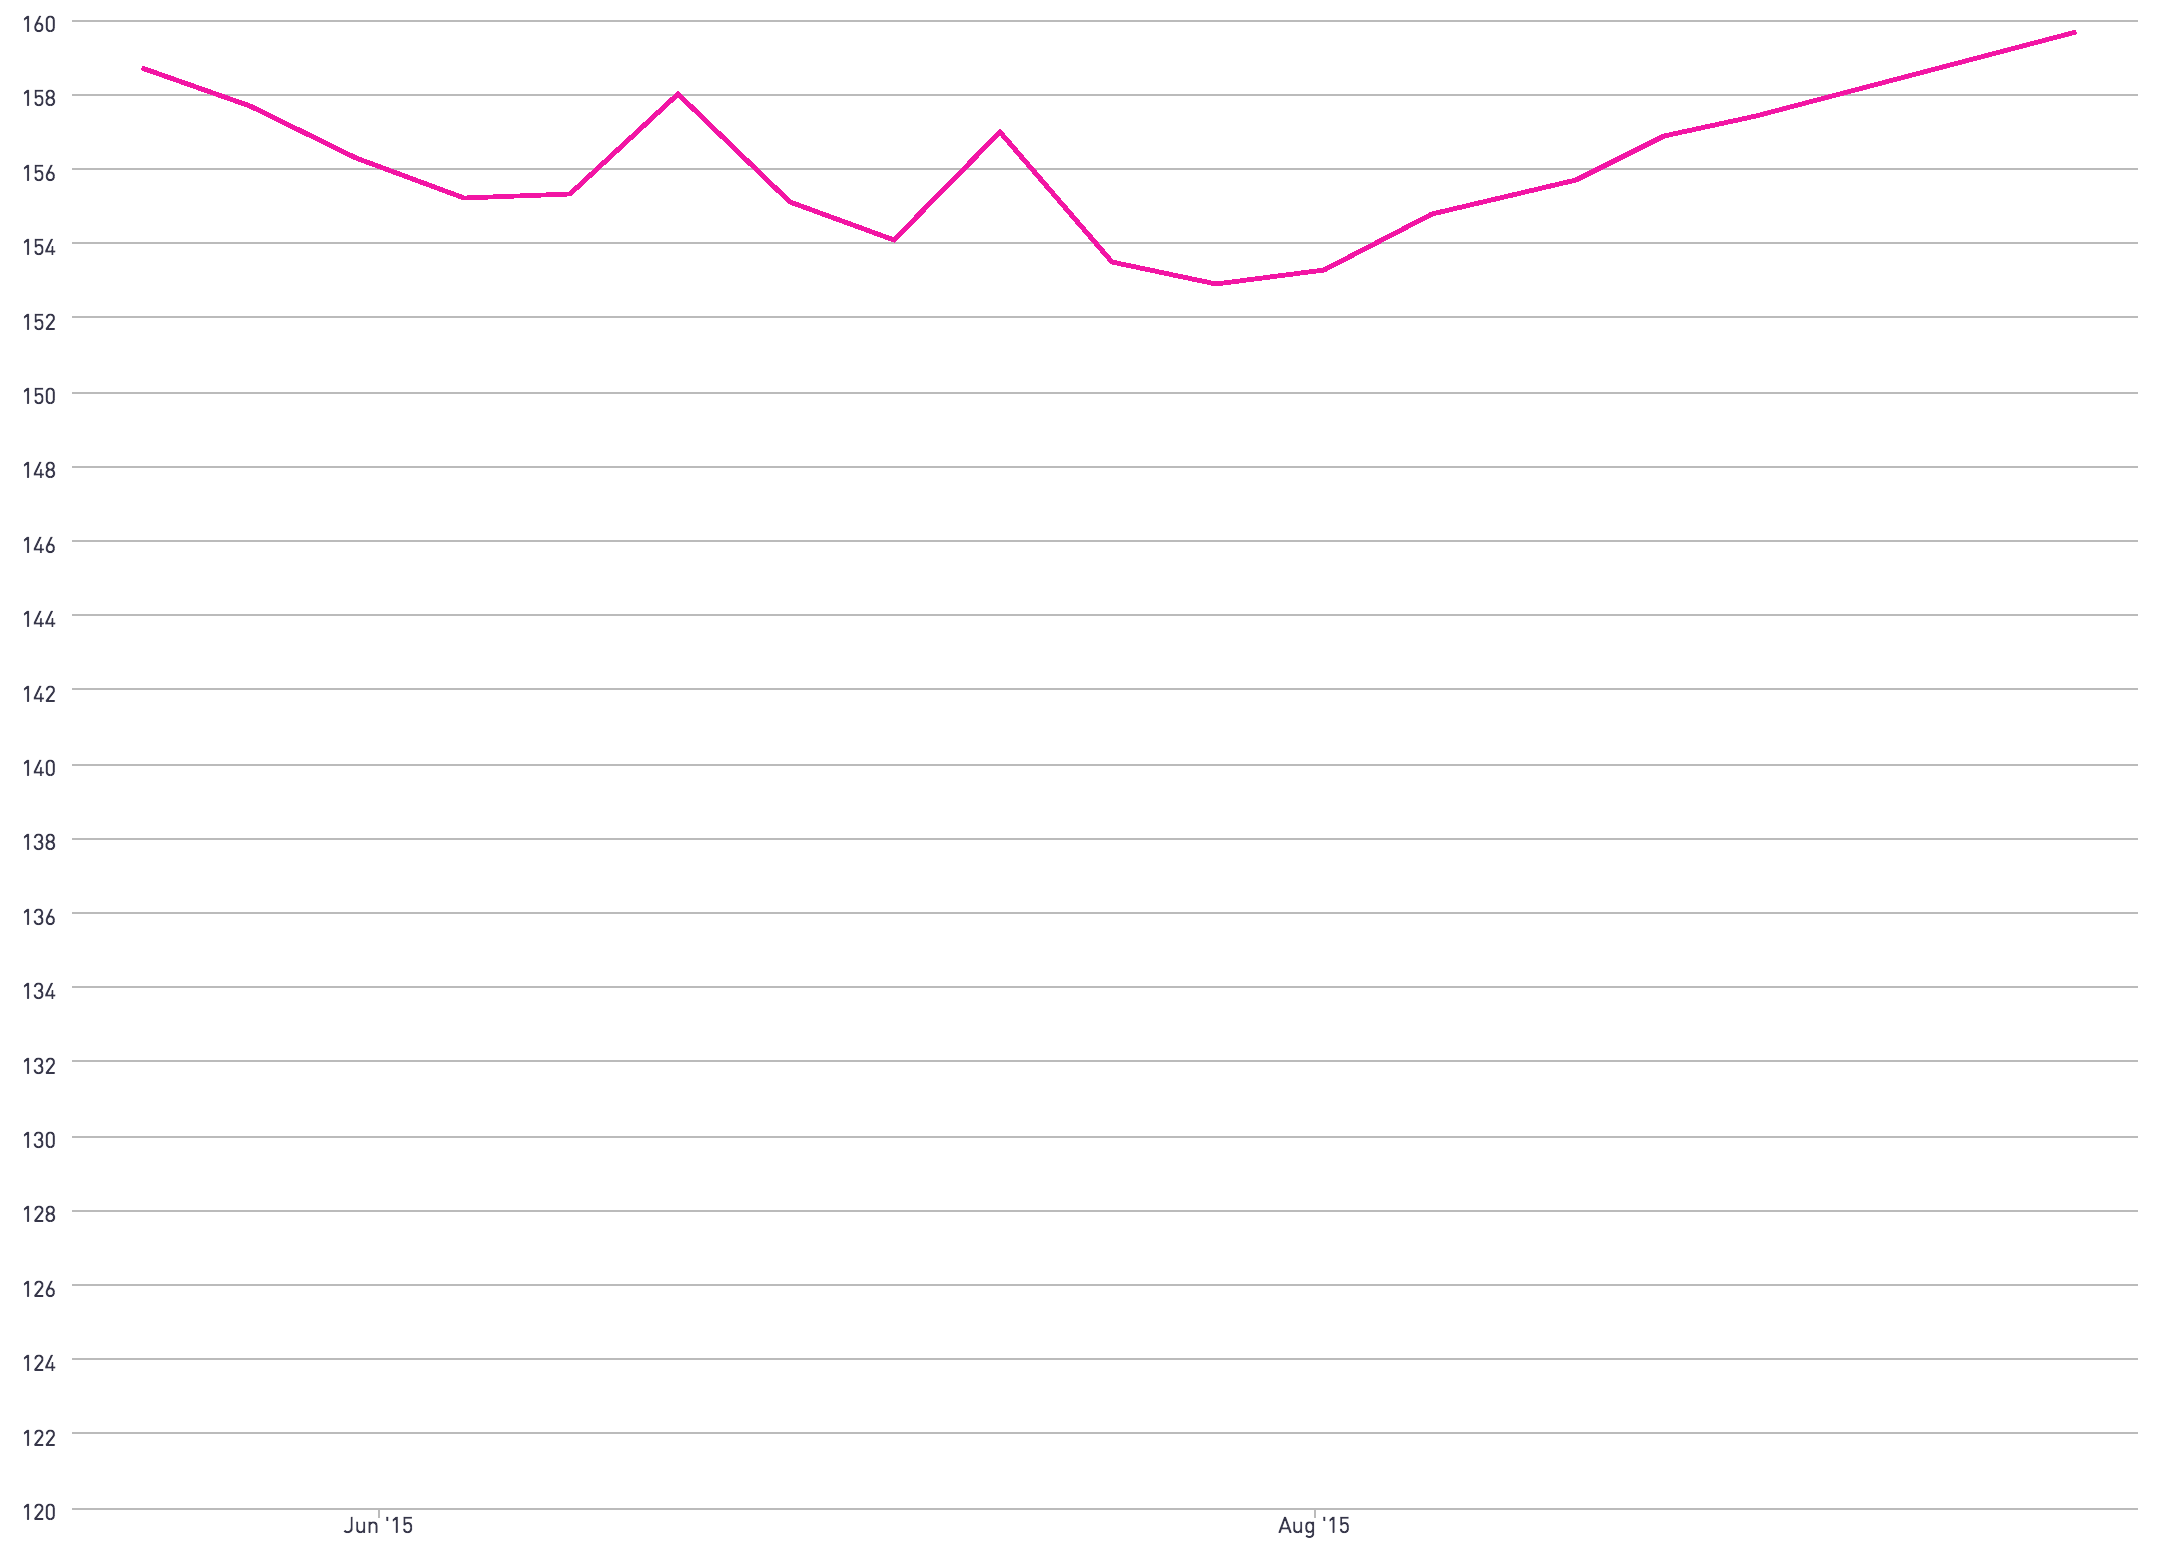
The takeaway: Weight loss progress takes time. Be patient and don’t let the number on the scale allow you to become emotional about your weight.